Introduction of BW-ZoneTrade Indicator
What is the BW-ZoneTrade indicator?
It is a technical indicator developed by renowned trader Bill Williams.
The BW-ZoneTrade indicator uses color-coded zones to indicate market trends. These colors are based on the strength of momentum (momentum) and the speed at which it changes (= acceleration), making it easy to visually grasp the point at which the trend is considered strong, and the indicator assists in identifying when to buy or sell.
Details are explained in his book New Trading Dimensions (published in 2007), chapter 7, "Trading in the Zones". (The preceding chapter (Awesome Oscillator, Accelerator) is also relevant.
If you are interested and would like to explore the use of the indicator in more depth and expand its utilization, please read on.
How to use the BW-ZoneTrade indicator in MT5
It is now standard in MT5's indicator list.
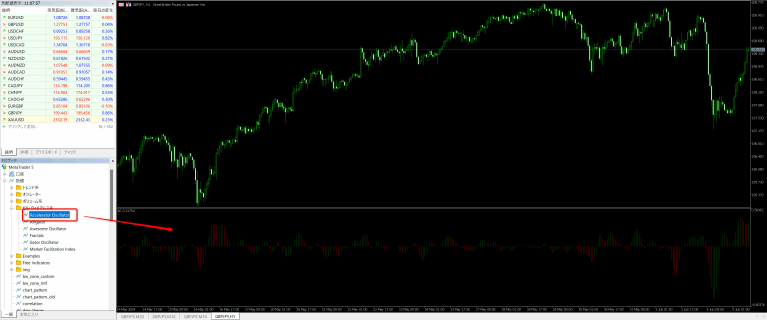
From the Navigator window in the side menu (if not available, select View → Navigator from the top menu),
Select Indicators →Examples → BW-ZoneTrade and you will be able to use it right away.

There is not a single parameter. It is a simple indicator.
Not long ago, it was something you had to download and use yourself from the MQL5.com codebase, but there were a lot of users? It is now incorporated as one of the standard indicators.
Color Meaning of BW-ZoneTrade
Green zone: rising zone
- When momentum and acceleration are confirmed to be increasing, the candlestick turns green. In other words, the green section suggests strong upward momentum.
Red zone: Falling zone
- If momentum is falling and acceleration is also rising in a falling direction, the candlestick turns red. In other words, a red section suggests strong downward momentum.
Gray zone: section where directionality is not allowed
- If the conditions of the green and red zones are not met, the candlestick will be gray.
| Momentum - Down | Momentum - rising |
| Acceleration - Rising | gray | green |
| Acceleration - Decline | red | gray |
Indicators on which BW-ZoneTrade is based and what they mean
Awesome Oscillator (AO): Momentum
(AO) is a technical indicator for measuring market momentum. It is calculated based on the difference between simple moving averages (SMA) over a given period.
AO is also included as a standard MT5 indicator and can be used immediately.
Calculation Procedure for AO
- Period setting:.
- To calculate the AO, we typically use a 5-period and a 34-period SMA (same average for Tange). These periods are chosen to capture both short and long term trends.
- To calculate the AO, we typically use a 5-period and a 34-period SMA (same average for Tange). These periods are chosen to capture both short and long term trends.
- Calculating the median price:.
- Calculates the median price (Median Price) for each period. The median price is the average of the high and low for each bar.
- Calculates the median price (Median Price) for each period. The median price is the average of the high and low for each bar.
- Short-term SMA calculation (5-period SMA):.
- Calculate the 5-period simple moving average of the median price.
- Calculate the 5-period simple moving average of the median price.
- Long-term SMA calculation (34-period SMA):.
- Calculate the 34-period simple moving average of the median price.
- Calculate the 34-period simple moving average of the median price.
- Calculation of AO values:.
- The value of the AO is the short-term SMA minus the long-term SMA.
- The value of the AO is the short-term SMA minus the long-term SMA.
Meaning of AO
- If the AO is rising: An increase in the AO value compared to one previous bar indicates stronger upward momentum. (In this condition, the AO indicator turns green.)
- If AO is falling: If the value of AO is falling compared to the previous bar, it indicates that the downward momentum is getting stronger. (In this condition, the AO indicator turns red.)
- AO is positive: The average short-term price is higher than the average long-term price, indicating that the market is in an uptrend.
- AO is negative: The average short-term price is below the average long-term price, indicating that the market is in a downtrend.
Accelerator Oscillator (AC): Acceleration
The Accelerator Oscillator (AC ) is a technical indicator for measuring changes in market momentum (acceleration). It is calculated by comparing the value of the AO to its SMA.
AC is also included as a standard MT5 indicator and can be used immediately.
How to calculate AC
- Calculation of AO difference:.
- Calculate the difference between the 5-period SMA of the AO and the current AO.
- Calculate the difference between the 5-period SMA of the AO and the current AO.
- Calculation of AC values:.
- Calculate the 5-period SMA of this difference value and use it as the value of AC.
- Calculate the 5-period SMA of this difference value and use it as the value of AC.
- Meaning: to
- If AC is rising: If the value of AC is rising compared to one previous bar, it indicates that upward momentum is accelerating. (In this condition, the AC indicator turns green.)
- If AC is falling: If the value of AC is falling compared to one previous bar, it indicates that the downward momentum is accelerating. (In this condition, the AC indicator turns red.)
How to use the BW-ZoneTrade indicator
How to use BW-ZoneTrade in your book 1. entry-decision
- Long entries are possible when the following three conditions are met, and additional entries are made continuously as long as the conditions are met.
- AO is green (=momentum rising)
- AC is green (= acceleration increases)
- Closing price is higher than the closing price of the previous bar
- AO is green (=momentum rising)
- AC is green (= acceleration increases)
- Closing price is higher than the closing price of the previous bar
- Short entry is possible when the following three conditions are met, and additional entries are made continuously as long as the conditions are met.
- AO is red (= rising momentum in the downward direction)
- AC is red (= accelerating upward in the downward direction)
- Closing price is lower than the closing price of the previous bar
- AO is red (= rising momentum in the downward direction)
- AC is red (= accelerating upward in the downward direction)
- Closing price is lower than the closing price of the previous bar
How to use BW-ZoneTrade in your book 2. trailing stop
- It is rare for a zone section to last for 6~8 consecutive runs, etc. After five or more bars in a row of consecutive zones, the exit is ready to begin.
- Set a stop one tick above (or below) the high (or low) of the fifth bar and continue moving the stop as long as the bar continues in the same direction thereafter.
- Exit when the bar changes color or the stop is hit.
Stocks and time frames for which BW-ZoneTrade works
It says, "It doesn't matter which time frame you use or whether you trade stocks or commodities..."
It appears to be a method of making a quick profit by pyramiding during a phase of strong trend, so it is thought to be compatible with stocks and time frames in which strong trends are easily confirmed.
Although FX stocks are not mentioned, there are some stocks that tend to trend strongly and others that do not, so there is no small degree of compatibility.
As for time legs, in general, the shorter the time leg, the stronger the random element tends to be, and therefore, we believe that it is easier to obtain better results if the evaluation is based on a somewhat longer leg.
Customize BW-ZoneTrade for FX trading
There is an impression that users who trade FX tend to prefer short-term trading. On the other hand, it is desirable to utilize trend trend indicators such as BW-ZoneTrade, taking into consideration not only the results of short-term decisions but also the results of decisions made over a somewhat longer period of time.
Make the indicator multi-timeframe
Develop a custom indicator to display the results of each hourly decision of BW-ZoneTrade on one screen.
Because BW-ZoneTrade is a type of indicator that is drawn as colored candles, it is not possible to display the results of multiple time periods on a chart at once.
Instead, I created a custom indicator that lists the results of the same indicator's decision for each time leg in a sub-window.
The result of each time leg at the relevant time can now be seen at a glance for easy confirmation.
However, I think we need a little more work to use it to determine specific entry points, etc.
Customize candlestick charts as well.
Furthermore, we have created another custom indicator that takes into account the multi-timeframe of the BW-TradeZone while also adding our own criteria.
Although this is slightly different from the original meaning of BW-TradeZone, I have the impression that it would work if entries were made on the short term leg as well, using the zone start position as a landmark.
It may also be combined with other indicators to increase the accuracy of entries and augment exit decisions.
For example, it may be effective to consider as valid signals only those that match the trend direction of the Dow Theory Indicator, or to dynamically manage stop-losses by considering rates that indicate a market reversal with evidence, such as push lows (=high lows in an uptrend) and return highs (high lows in a downtrend), to be trail prices. It may also be effective to dynamically manage stop-losses by considering rates that indicate a well-founded market reversal as trail prices.
The examples in the book seem to be Pyramid + Trailing -> Batch Settlement, but it seems that it can be applied to short-term trading by customizing it to suit your own trading style.
summary
We have only done a rough development, but it seems that there may be various ways to use it, such as narrowing down the points where entry is advantageous, detecting trend stalls after holding a position, and closing the position early. I would like to incorporate it into the EA and utilize it for quality improvement while continuing to dig a little deeper.
Use multiple indicators in combination!
To improve the accuracy of technical analysis, it is essential to evaluate multiple indicators in combination with each other in a comprehensive manner.
We are expanding our lineup of originally developed indicators on this site so that they can be used immediately,
Please also refer to the other indicator introduction articles.
Indicators are available free of charge!
This indicator is
Aiming for 100% annual interest! Automated Trading Tool Helios
is distributed free of charge to those who use the automated trading tool "Helios" in their real accounts.
https://smart-trading-strategy.com/selene-dow-theory-based-swing-trading-ea/?lang=en
We will provide you with an indicator and a set of support documents when you contact us through our service desk.
*Indicator-only use is available for a fee. Please contact the service desk for details.
If you want to use MT5, I recommend an overseas brokerage firm!
The secret to successful FX investing with MT5 is to combine it with an international brokerage firm.
Domestic Securities Companies
❌ Few MT5-compliant vendors exist.
❌ There is a risk of additional margin. May incur losses in excess of the amount deposited.
Securities Companies
✅ Many brokerages offer a zero-cut system that allows you to risk no more than the amount of your deposit.
✅ Major foreign brokerages such as HFM and XM are safe to use.
- Ability to trade in a low spread environment
- Take advantage of deposit bonuses to start trading with small amounts
- No deposit and withdrawal problems.
- Stable execution with minimal trade delays
If you use MT5, please consider opening an account at an overseas brokerage firm.
summary
To achieve efficient investment,
structuring and automation
is essential.
We will continue to compile ideas to help you analyze the market environment and provide you with tools that you can use immediately.
Automated trading tools make it possible to automate trades, but the decision of when to start and stop the EA is a personal decision.
In order to use the EA wisely, we hope you will make use of the indicator to help you analyze the market environment.
Related


