
Launch of Selene: New High-Win Rate MT5 Day Trading EA


I have been immersed in development for a while and have not been able to update this article, but I have been working on various EA development and indicator features to validate my trade ideas.
Now that development has settled down a bit, we would like to introduce new features one by one. As a first step, we would like to introduce one of the new features of the Dow Theory Indicator! If you have not yet used the new function of the indicator, please take a look at it.
The Smart Money Concept is an approach to finding an effective trading strategy by estimating the impact of trading by institutional investors and other participants that have a large impact on the market, based on candlestick patterns and waveforms, to derive key resistance lines and other points that are likely to become specific trading conditions. This is an approach to seek effective trading strategies.
I have the impression that the number of users is gradually increasing in Japan, and many traders have carefully explained the concept on overseas websites and Youtube videos, indicating that it is widely spread as a way of thinking.
The result of studying Dow Theory and SMC respectively,
Similarities.
There are similarities in the concept of environmental awareness, and the SMC base concept is easy to understand for those who understand the trend continuation and market reversal of Dow Theory
→ Push Low/Return High ≈ BOS(Break Of Structure)
→ Dow trend reversal ≈ CHOCH(Change Of Character)
Used in combination, the two approaches complement each other.
Because of these advantages, we first tried to integrate them as a single indicator.
Added functions to utilize the main elements of the SMC, such as
In this article, I would like to introduce the first, FVG.
This may sound a little complicated, but it can be easily understood by looking at a chart, so let's start with the indicator and see what kind of function it has.
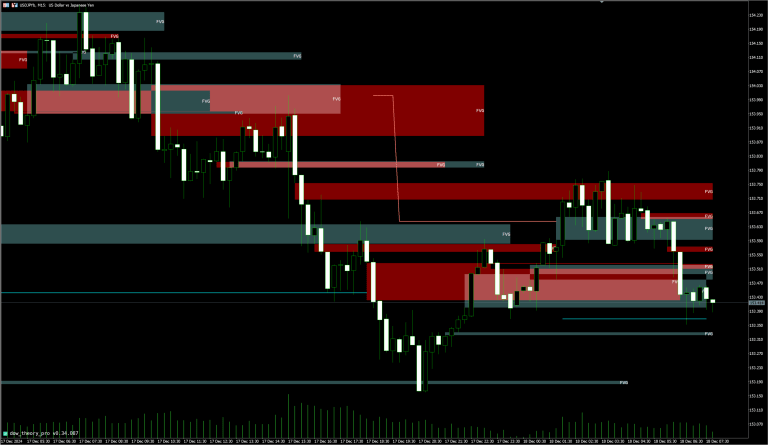
The red/green rectangle shown is the zone that indicates "FVG".
In some places, the rate reverses as if sucked into the zone, and you can see how the zone functions like a "wall".
Just looking at this is exciting because it will give you ideas that you can apply to your trades.
Let's take a look at what FVG is in the first place, on what basis it is detected, and how to make use of it in trading, understanding each in turn.
It stands for Fair Value Gap, which translates directly to "fair price gap" in Japanese.
This is one of the candlestick patterns used to explain the concept of SMC.
Result of rapid rate fluctuations in a short period of time at certain price points due to the participation of smart money and other factors,
Rate is likely to return in the direction of closing the gap
After the gap is filled, the trend is likely to reverse again and extend in the direction of the trend
It is said to have the following properties.
It is easy to understand the anomaly in FX trading as well, such as "after opening a window, it is easy to fill the window" at the beginning of the week on Monday, which is similar to the anomaly.
Fair price is the price level at which the issue is theoretically considered appropriate.
When the current price is at an appropriate level, demand (=buying) and supply (=selling) are almost equally present and price movements are stable.
Indicates that a consensus has been formed among market participants at the current price and that there are no major price fluctuations (= imbalances).
A price range where trading volume (=volume) is stable and a range is formed is a fair price.
It is a situation where there is a gap relative to the fair price, i.e., an imbalance between supply and demand.
Imbalances in supply and demand are created by participants who believe that the current price is not a fair price due to various influences such as market trends, economic indicator releases, and policy changes.
If demand is great, prices will rise; if supply is great, prices will fall.
This price volatility often results in short-lived and sudden imbalances due to the participation of smart money, and FVG is a condition in which these large price fluctuations manifest themselves as large gaps from the fair value.
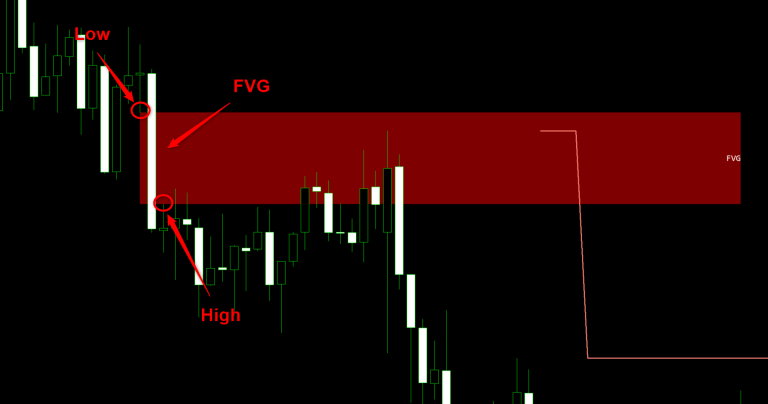
The simplest and most common method of identification is to use three consecutive candlesticks.
The two previous bars must be positive.
3 previous high < 1 previous low (=gapped, windowed)
The third one, the first one, can be positive or negative.

The two previous bars must be negative.
3 previous lows < 1 previous high (=gapped, windowed)
The third one, the first one, can be positive or negative.
We have explained the simplest method of detecting FVG, but under such conditions, FVG is detected in large quantities and is difficult to use as a trade signal due to its high noise level.
In order to make the most of the trade
However, by utilizing FVG and Dow Theory, it is possible to formulate strategies while establishing specific criteria for all of these steps. Here is an example.
Price changes that are too small are considered weak evidence of "imbalance". By targeting a certain number of positive/negative lines that record a gap and are large enough, noise can be eliminated.
This indicator allows the size criterion of the bar that records the gap to be adjusted from a parameter.
| Bar size filter: No | Bar size filter: Yes |
 |  |
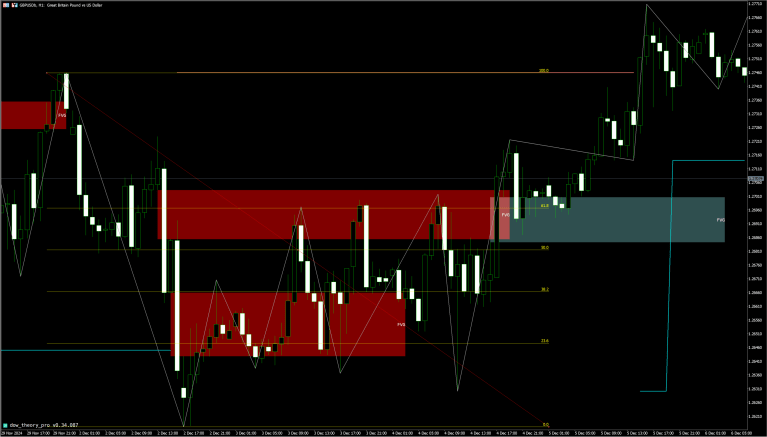
An additional rule that calculates the Fibonacci retracement for the wave that recorded the FVG and uses it as a signal only when there is a return of 50% or more (= half price reversal) would also be effective.
The larger the return, the larger the profit margin on a reverse entry can be expected to be.
The starting and ending points of the wave can be easily identified by using the zigzag line of the Dow Theory indicator.
If multiple FVGs are detected in a single wave, rules such as using only those with a return rate of 50% or more may also be effective.
In addition to using the FVG detected in the upper leg to identify rough entry opportunities, check to see if a market reversal signal has been established in the lower leg.
A market reversal in SMC is expressed as CHOCH (Change Of Character), and since the concept is very similar to that of a trend reversal in Dow Theory, Dow reversal signals can be utilized.
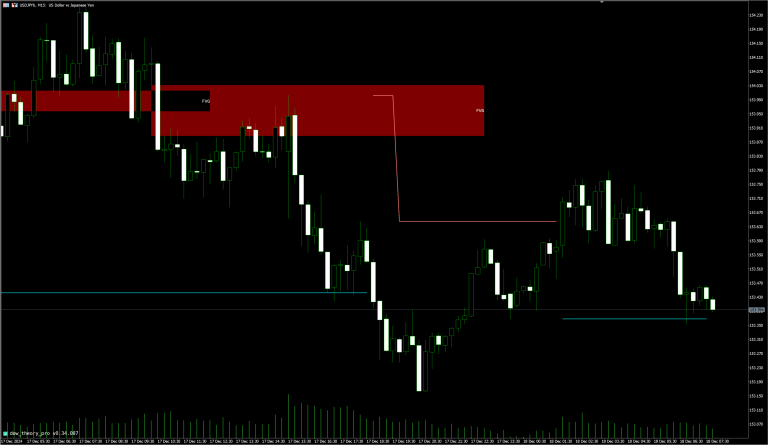
The FVG display of this indicator supports multiple time frames, so there is no need to switch between charts.
For example, if you activate the Dow Theory indicator on a 1-minute chart and set it to display the FVG of a higher leg, such as a 15-minute or 30-minute chart, you can achieve multi-timeframe analysis on a single chart.

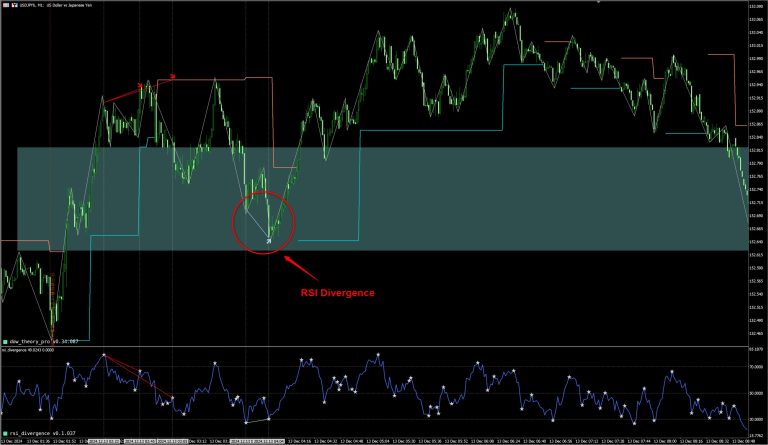
Trading using FVG is mainly a contrarian trade with small losses and large gains. In terms of capturing signs of a reversal after a market reversal, it is considered to be a good match when combined with divergence indicator utilization.
Adding the RSI divergence indicator to the previous image shows that the RSI divergence is detected earlier than the trend change in the Dow Theory indicator.
By attempting to enter early at such points, you can set a shallower stop-loss price, and if you use RSI divergence detection as an additional condition at the time of a Dow trend turn, you can expect a higher winning rate, although the entry frequency will be reduced.
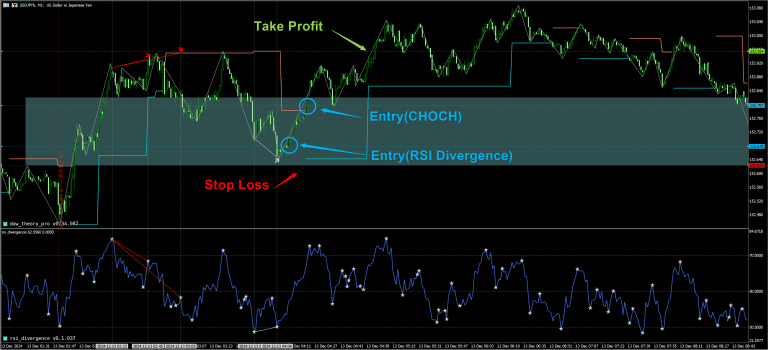
In the case of an FVG rise, the lower limit of the zone can be used as the stop loss line. Conversely, in the case of a downward FVG, the upper limit of the zone is used as the stop loss line.
On the other hand, the target for profit-taking will be near the highs from the formation of FVG to the present, with the aim of settling in the short term.
In the above example, the risk reward ratio is approximately 1:1, since the distance from the entry price to the stop loss is approximately 18 pips and the distance from the entry acc to the limit price is approximately 16 pips.
A risk reward ratio of 1:1 means that 1 win and 1 loss (50% win rate) is the approximate break-even line. (In reality, this is an approximate guideline because the width of the stop loss limit varies from case to case.)
Since rates often reverse to some extent before confirming a Dow turn, the risk-reward ratio tends to be low, but on the other hand, it is expected to increase the win rate, so the level of risk-reward ratio may be sufficient to make it a viable strategy.
In the above example, the risk reward ratio is approximately 1:4.6, since the distance from the entry price to the stop loss is approximately 6 pips and the distance from the entry acc to the limit price is approximately 28 pips.
In this case, the break-even line is approximately 1 win and 5 losses (17% win rate). (In reality, this is an approximate guideline, as the width of the stop-loss line varies from time to time.)
Even if the win rate is low, the loss per trade can be kept small, and a win rate of 20% with RSI divergence is a level that can be expected.
The drawback is that the more stringent the conditions, the less frequently it is detected, but it is one of those patterns that you want to trade aggressively when you find it.
Secure trade opportunities by activating the indicator on multiple stocks and checking a wide range of stocks.
We consider it to be no more than once, since returning to the zone once will reaffirm the fairness of the price range in the relevant gap.
However, if the zone is wide, it is best to look at it from the perspective of whether the current rate has been tested at least once.
No indicator will ever function with 100% accuracy.
It is important not to be overconfident in FVG alone, but to consider the judgment results of other indicators, FVG's multi-timeframe analysis, and other factors to increase the reliability of the trade while confirming multiple evidence.
In this issue, we explained the upgraded version of the Dow Theory Indicator and one of its new features, FVG.
Many other features have been added, so we hope you will try the indicator and find it useful in improving your trading win rate.
Also, I am sure there are many different trade ideas that utilize FVG. If you have a good idea, please share it with us. In some cases, we may be able to create an EA, so we welcome your ideas!
You can try the indicator for two weeks free of charge. We encourage you to take advantage of the free trial so that you can evaluate whether there is anything you can apply to your own trading by actually running the indicator.
If you have traded more than a certain amount in your real account opened via this blog, you can continue to use the indicator for free after the trial ends.
We hope you will take advantage of the Dow Theory Indicator and its new features to trade smarter!

